PT Safiullin Digital IndonesiaHSS GDT
My workspace
Company homePT SAFIULLIN DIGITAL INDONESIA / GANODERMA DETECTION TECHNOLOGY
PLANTATION INTELLIGENCE · GANODERMA RISK

Find the signal.
Protect the hectare.

For oil palm owners and operating teams in Indonesia and Malaysia. HSS GDT brings observations together to map risk signals and prioritise field inspection. Data sources, verification and pilot scope are agreed for your estate.

Risk signals to prioritise field inspection

The estate from orbit
Survey of the blocks
01 / 05 · SatelliteThe estate from orbit

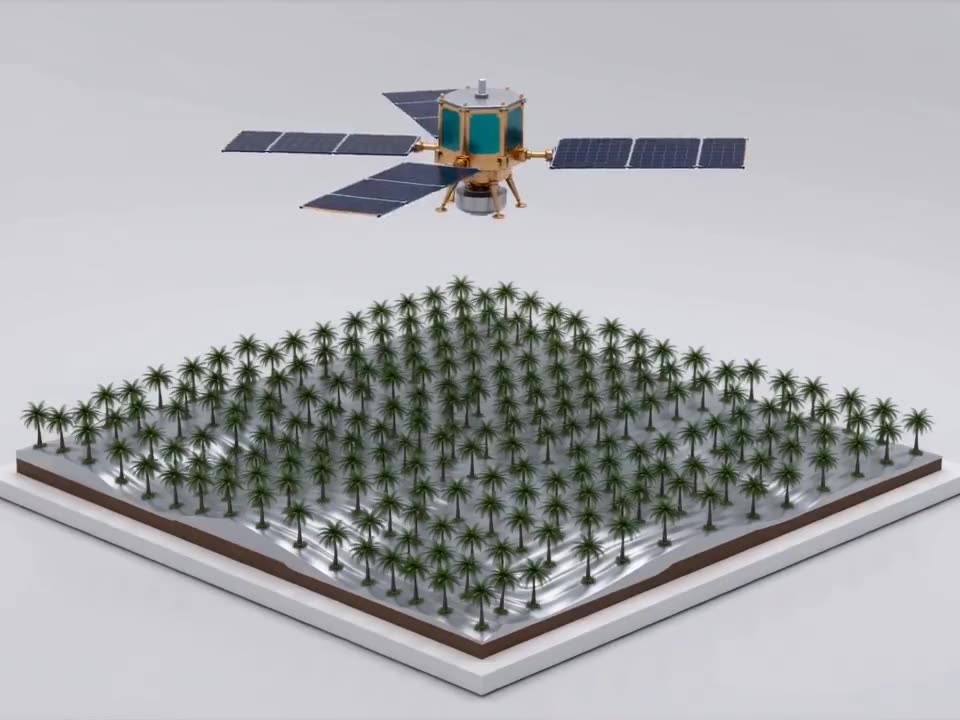
Satellite data covers the whole plantation and shows which blocks need a closer look.

Illustrative visualisation, not client data
Early signals. Field inspection. Informed action.PT Safiullin Digital Indonesia · Indonesia & Malaysia
Flight simulator

A survey flight, from the orthophoto to one palm.

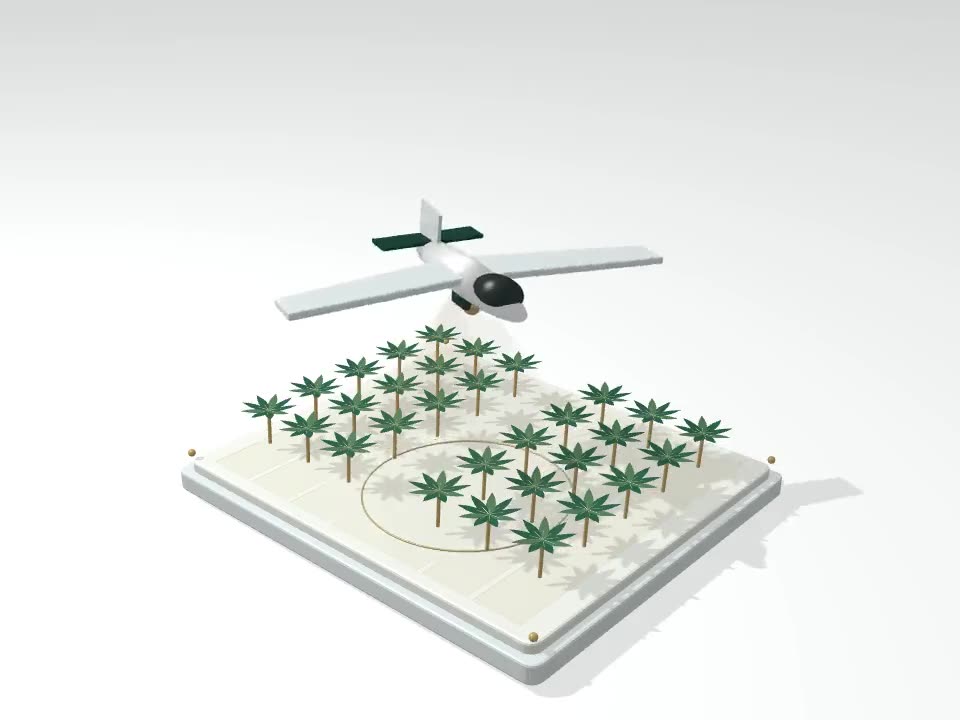
A rotary-wing UAV flies survey lines over a projected orthophoto of an oil palm block. Above a palm with a risk signal it slows down, hovers and takes a hyperspectral snapshot.

Animated illustration: a rotary-wing UAV flies survey lines over an oil palm block and takes a hyperspectral snapshot of palm B-07-14.Illustration. Not client data and not the detection algorithm.
Project economics

What early detection is worth on your estate.

Enter your plantation area and the expected spread of the disease. First you see what you save and keep earning, then what the inspection costs.

Configure observation sources

What you save and earn

Economic effect per year$ ••• •••Avoided loss of the saved hectares, net present value at 10 %.
You save on replanting
•••
You keep in revenueover 8 years until a replanted block returns to full yield
•••

See your calculation

Enter your email to open the full result. Our specialist may contact you about this calculation. We do not create an account or send newsletters.

Loss per hectare: GDT Ganoderma loss model built from primary sources (replanting cost, revenue recovery curve, 10 % discount rate), August 2026.

About the project

From a research method to a working system.

Ganoderma basal stem rot is the most damaging disease of oil palm in Indonesia and Malaysia. By the time the crown shows symptoms, the palm is usually lost and the infection has spread to its neighbours.

HSS GDT was created to find the disease earlier. The project connects satellite monitoring, UAV inspection, ground sensors and laboratory verification into one system with an AI core, built by an international team of engineers and scientists.

50
specialists: management, scientists and IT developers
5
observation layers in one system
2
countries of operation: Indonesia and Malaysia
Our method

Connected observations. A documented assessment.

Start with the estate, then inspect selected areas. Record the sources, field checks and any laboratory results behind each assessment.

  1. 01

    Satellite screening

    Changes across the estate show which blocks need inspection.

  2. 02

    UAV inspection

    Fixed-wing LiDAR and thermal survey, then rotary-wing hyperspectral imaging of the selected palms.

  3. 03

    Ground sensors

    Planned sensor integration adds local observations when a calibrated device and verified data stream are available.

  4. 04

    AI and laboratory

    AI supports the comparison of observations. Field and laboratory checks, where performed, are documented in the inspection report.

Risk signals to prioritise field inspection

HSS GDT brings observations together to identify areas that need attention. A risk signal guides the next field check; it is not a confirmed diagnosis.

Field and laboratory verification are recorded separately from spectral risk signals. The report identifies the method and evidence available.

GDT / THE MULTIMODAL SYSTEM

One plantation. Every perspective.

From an estate-wide view to evidence at an individual palm. Explore what each layer contributes to one connected decision.

01 / SPACE

See the bigger picture.

Satellite observations provide the broad context: the estate, its blocks and changes over time. Areas that need attention become the starting point for a closer inspection.

The outcome
Estate overview
Priority areas
Change over time
See the bigger picture.
SDI / SATELLITE
Conceptual visualization · activate 3D to exploreIllustration

Illustrative scenes show the role of each layer. They do not display live plantation data or the proprietary detection method.

CONFIGURE YOUR COVERAGE

Build the right system for your estate.

Choose observation sources and the level of verification. Your estimate updates with each choice.

The expected share of the estate requiring detailed inspection. This is a planning input, not a measured infection rate.

Tap or click the source cards to select them. Drag the slider to adjust the risk-zone share.

Basic laboratory analysis included · $0.20 / ha

GDT / YOUR CONFIGURATION

Estimated annual budget

—USD / ha / year
Monthly equivalent—

Reference estimate from the supplied configuration workbook, not a confirmed pilot tariff. Pilot price and scope are agreed individually. Additional services are priced on request.

SDI / REGIONAL ATLAS

The region. The opportunity. Your estate.

Explore oil palm areas across Indonesia and Malaysia. Select regions, compare hectares and request a local inspection.

Sumatra≈ 8M–9M haKalimantan≈ 6M–7M haSulawesi400K haIndonesian Papua500K haJava + Bali< 100K haPeninsular Malaysia2.54M haSabah1.5M haSarawak1.66M ha
94°E — 142°E / WGS 84
Indonesia · Selected planted area≈ 14,900,000–< 17,000,000 ha

Company estimates · source year not specified unless stated

Malaysia · Selected planted area5,700,051 ha

MPOB · December 2025

All Malaysian regions total 5,700,051 ha; MPOB national total: 5,700,050 ha. The 1 ha difference is rounding.

Regional areas are not plantation boundaries or monitored coverage. Province figures are subsets of island figures; the two views are counted separately. Natural Earth · BPS · Indonesia 2025 · MPOB 2025

HSS GDT / FAQ

Before we talk

How does a pilot start?

Start with a request describing your estate and objectives. We agree the available sources, verification steps, scope, mobilisation and timing for the pilot.

Does it replace our agronomy team?

It gives your team a risk map, evidence and priorities to support field decisions. Agronomy actions remain part of your plantation operations.

How is the price calculated?

The annual price depends on area, observation sources, Pro and the share of risk zones. Regional operating conditions, taxes and any additional services are clarified in the proposal.

What do you need to prepare a proposal?

The country, estate location, managed area and your contact details. Plantation boundaries and existing maps can be shared during the follow-up.

Request

Request a pilot for your plantation.

Tell us where the plantation is and what you want to achieve. Scope, timing and terms are agreed for your estate.

Locate your plantation

Provide a full address or both WGS 84 coordinates in decimal degrees. The area is your declared area; coordinates mark a point.

How your data is used

The form stores your contact details, company, plantation location, area and request to arrange a response. It does not subscribe you to marketing. For access or deletion, contact SDI@ganodermadetection.com.